Timeline statistics infographics vector
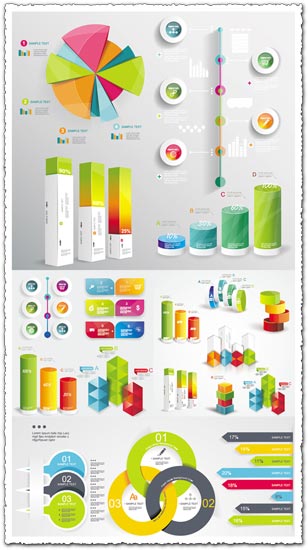
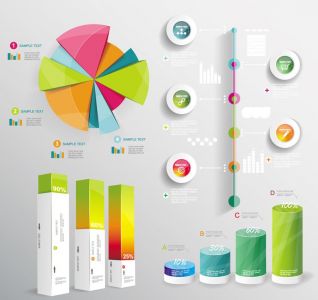
Description: This vector collection offers four professionally designed infographics templates focused on presenting timeline statistics. Each template features colorful and visually appealing elements, including charts, graphs, and icons, ideal for conveying statistical data in a clear and engaging manner.
Usage: Utilize these infographics in presentations, reports, or marketing materials to showcase chronological data, historical trends, or project milestones. Whether you’re presenting quarterly sales figures, project timelines, or demographic trends, these templates provide a visually compelling way to communicate complex information effectively.
Download: Access the AI files containing the infographics vectors to incorporate them into your projects seamlessly. Customize the templates with your own data, text, and branding elements to create personalized visuals tailored to your specific needs. With these versatile templates, you can elevate your data presentations and captivate your audience with impactful storytelling.
HELLO, PLEASE TURN YOUR ADBLOCK OFF IN ORDER TO DOWNLOAD THE FILE!
It looks like you're using an ad blocker. That's okay—who doesn't? But without advertising income, we can't keep making this site awesome.



good very good idea
good very good