Statistic charts infographics vector
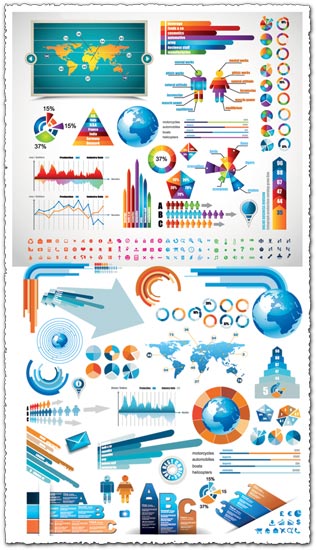
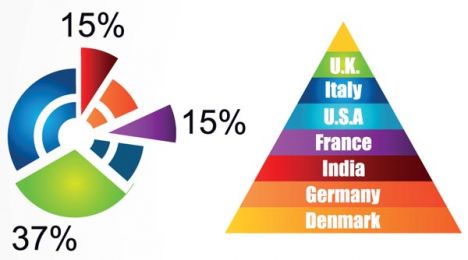
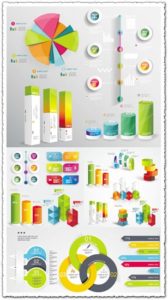
Description: Elevate your data visualization game with our Statistic Charts Infographics Vector set. This collection includes two meticulously crafted EPS vector files showcasing dynamic pie charts, accompanied by JPG previews for easy reference and integration.
Usage: Utilize these professionally designed charts to present statistical data, analysis results, or survey findings in a visually engaging manner. Perfect for reports, presentations, dashboards, and infographics, these vectors help convey complex information with clarity and style.
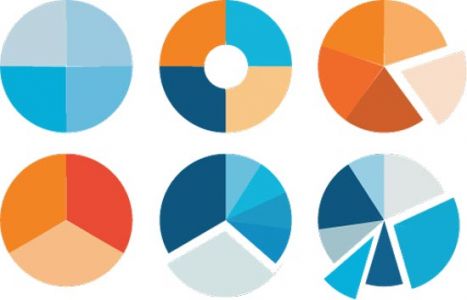
Design: Each vector in this collection features a sleek and modern design, with clean lines, bold colors, and clear labeling. The pie charts are meticulously crafted to effectively communicate proportions and percentages, ensuring that your audience can easily grasp the insights presented.
Download Now: Download our Statistic Charts Infographics Vector set to add a professional touch to your data presentations. Whether you’re analyzing business metrics, tracking project milestones, or visualizing survey data, these vectors provide the visual tools you need to effectively communicate your message.
HELLO, PLEASE TURN YOUR ADBLOCK OFF IN ORDER TO DOWNLOAD THE FILE!
It looks like you're using an ad blocker. That's okay—who doesn't? But without advertising income, we can't keep making this site awesome.







Leave a Reply