Isometric Cityscape Infographics: Vector Buildings with Charts

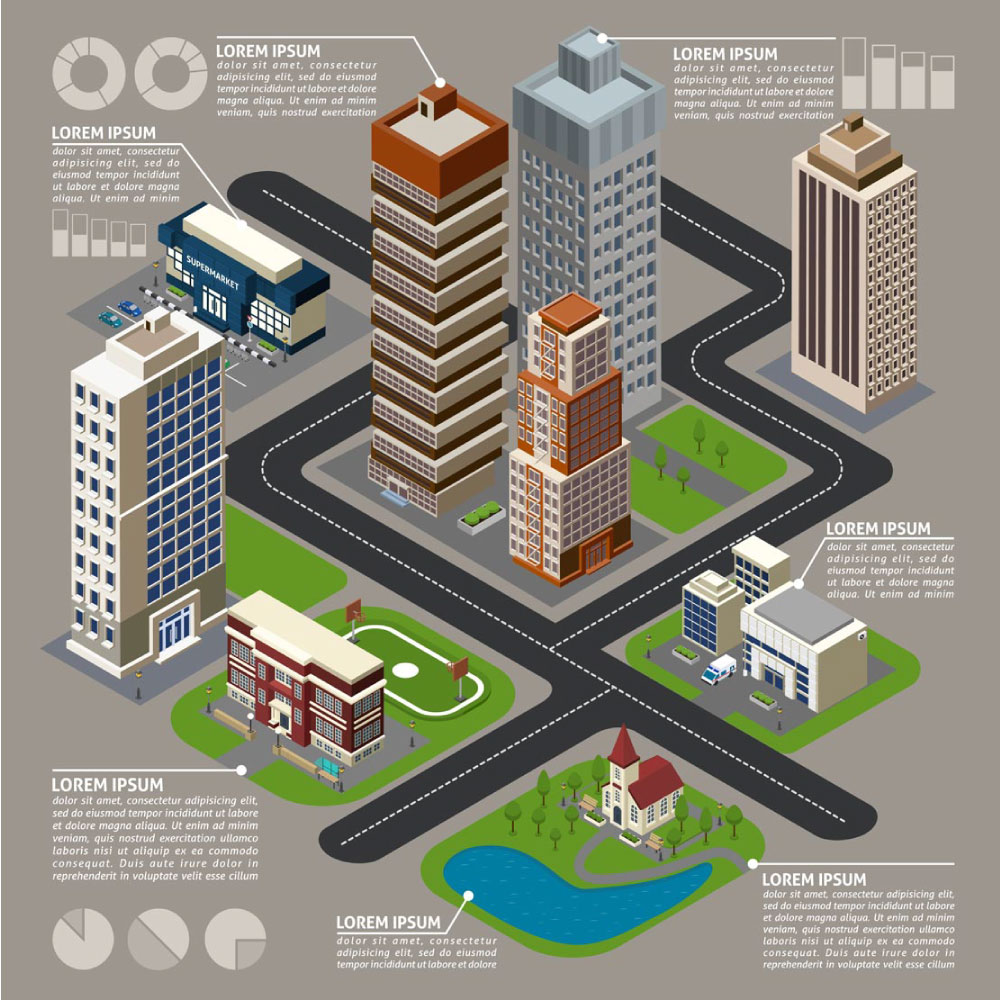
Description: Explore the urban landscape with isometric cityscape infographics featuring vector buildings seamlessly integrated with dynamic charts. This collection presents a modern and visually engaging way to represent statistical data within a cityscape setting. Each building is meticulously crafted to accommodate various chart types, offering a unique blend of architectural design and data visualization.
Usage: Incorporate these isometric cityscape infographics into presentations, reports, or marketing materials where data visualization is key. Ideal for urban planning presentations, real estate reports, or demographic analyses, these infographics provide a compelling visual narrative that captures attention and communicates complex information with clarity.
Download: Access the isometric cityscape infographics directly from this source. Click on the download link provided to obtain these versatile vectors, ready to transform your data into captivating visual stories set against the backdrop of a dynamic urban landscape.
HELLO, PLEASE TURN YOUR ADBLOCK OFF IN ORDER TO DOWNLOAD THE FILE!
It looks like you're using an ad blocker. That's okay—who doesn't? But without advertising income, we can't keep making this site awesome.


