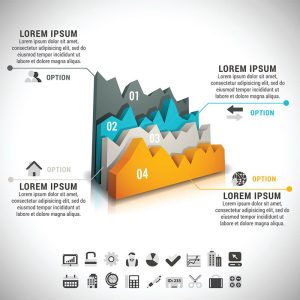
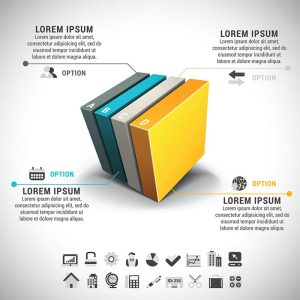
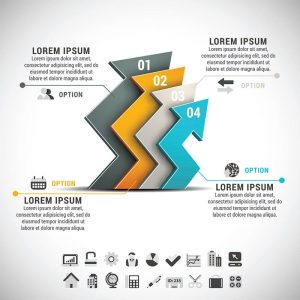
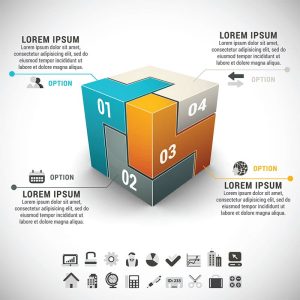
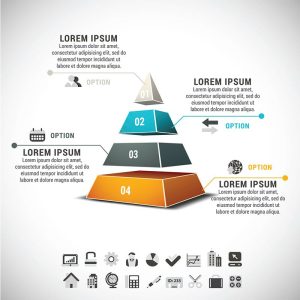
Colorful 3D diagram bars vector infographic
Description: This vector infographic presents a dynamic visualization of colorful 3D diagram bars, arranged in a visually appealing manner to represent various data points or categories. Each bar is depicted with vibrant colors and three-dimensional depth, creating a sense of visual hierarchy and emphasis. The infographic employs a modern and dynamic design aesthetic, making it suitable for presenting complex data in a visually engaging format.
Usage: Use this infographic to illustrate statistical data, market trends, survey results, or any other quantitative information in a visually compelling way. The 3D diagram bars allow for easy comparison and analysis of different data sets, while the colorful design adds visual interest and enhances viewer engagement. Incorporate this infographic into presentations, reports, dashboards, or marketing materials to effectively communicate your message and capture the attention of your audience.
Download: Access the vector files of this infographic to customize the data, colors, and layout according to your specific needs. Whether you’re creating a financial report, sales presentation, or business dashboard, this colorful 3D diagram bars infographic will help you convey complex information with clarity and impact.
HELLO, PLEASE TURN YOUR ADBLOCK OFF IN ORDER TO DOWNLOAD THE FILE!
It looks like you're using an ad blocker. That's okay—who doesn't? But without advertising income, we can't keep making this site awesome.


